Can you draw a line with a single point? Sure you can, but it may not tell you anything. Join Gilad Shainer as he discusses high performance networking and single point performance metrics. You may want to read Real Application Performance and Beyond and Optimum Connectivity in the Multi-core Environment as well.
High-performance computations are rapidly becoming a critical tool for conducting research, creative activity, and economic development. In the global economy, speed-to-market is an essential component to get ahead of the competition. High-performance computing utilizes compute power for solving highly complex problems, perform critical analysis, or run computationally intensive workloads faster and with greater efficiency. During the time needed to read this sentence, each of the Top10 clusters on the Top500 list would have performed over 150,000,000,000,000 calculations.
HPC clusters have become the most common building blocks for high-performance computing. Clusters provide the basic needs of flexibility and deliver superior price/performance compared to other proprietary symmetric multiprocessing (SMP) systems, with the simplicity and value of industry-standard computing. A clusterâs ability to perform depends on three elements â the central processing unit, the memory on a single server, and the interconnect that gathers the single servers into one cluster.
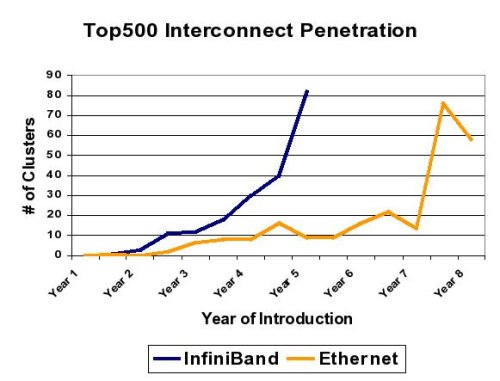
The TOP500, an industry respected report since 1993, ranks the most powerful computer systems and provides an indication on usage trends in computing and interconnect solutions. According to the TOP500, InfiniBand is emerging as the most used high-speed interconnect, replacing the proprietary or low-performance solutions. As shown below, InfiniBand shows higher adoption rate in the TOP500 comparing to Ethernet. The graph compares the adoption rate of InfiniBand and Ethernet, from the first year they were introduced to the TOP500 list (InfiniBand â June 2003, Ethernet â June 1996).

Single-points of Performance
The most common approach for comparing different interconnect solutions is the âsingle-pointsâ approach. Latency, bandwidth, N/2 and message rate are known as single-points of performance used to make the initial determination. When referring to bandwidth, it is typical to report the maximum available bandwidth. Message rate, defined as the numbers of messages transmitted in a period of time, is yet another single-point on the bandwidth graph. Message rate bandwidth (bytes/second) divided by the length of the message (typically done for 0 or 2 bytes) resulting in messages per second metric. Note: that a zero byte message still requires data to be sent.
N/2 benchmark provides a better understanding of the bandwidth characteristics, as it indicates the point where the interconnect achieves half of its maximum capability, therefore provides an indication on the bandwidth curve. However, the N/2 number must be followed with the corresponding bandwidth number or else it can be misleading. A higher bandwidth solution can present higher N/2 compared to a lower bandwidth one, while its bandwidth graph is higher for a single-point. An example is shown later in this paper.
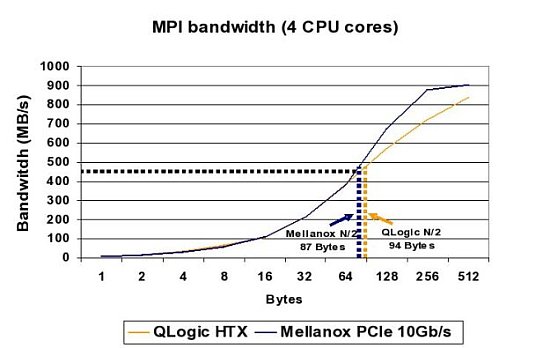
Any set of single-points relate to a specific application or application interface, and each application interface has a different set of parameters associated with it. The most common application interface in high-performance computing is Message Passing Interface (MPI). Among the single-points of performance, the N/2 benchmark provides an additional indication on the interconnectâs capabilities â how fast the bandwidth curve rises. Lower N/2 results in higher actual or effective bandwidth delivered by the interconnect to the applications. The following graphs compare the N/2 MPI benchmark between the two InfiniBand providers, Mellanox and QLogic.

Mellanoxâs InfiniBand 10Gb/s PCIe adapter delivers lower N/2 than the QLogic HTX InfiniPath adapter, and therefore delivers overall higher, effective bandwidth. QLogic had reported N/2 of 88 Bytes on an 8 core server, yet it is still higher than the Mellanox 10Gb/s adapter on a 4 core server, as shown in the graph.
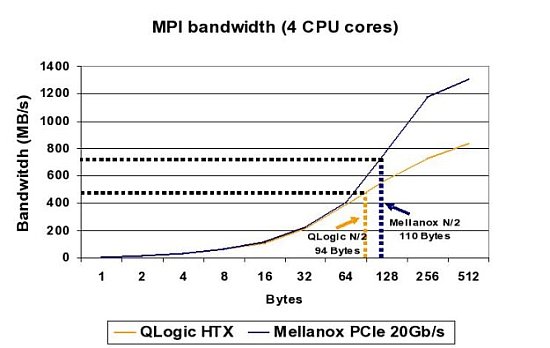
The second graph compares between the best performance solutions from Mellanox and QLogic â Mellanoxâs InfiniBand 20Gb/s and QLogicâs InfiniPath HTX. The result is a good example of how N/2 can be misleading, if not followed by the corresponding bandwidth figures. Mellanoxâs 20Gb/s achieves higher N/2 of 110 Bytes versus QLogicâs N/2 of 94 Bytes, but as the graph shows, Mellanox has a superior bandwidth curve, and therefore has an overall higher, effective bandwidth.

The bandwidth advantage of Mellanox increases with message size to about 50%. Mellanox achieves QLogicâs maximum BW (of 954MB/s) in message size of ~200 Bytes and provides maximum uni-directional bandwidth of more than 1400 MB/s (Mellanox adapter is capable of almost 2000MB/s uni-directional bandwidth and limited by the current system components).


